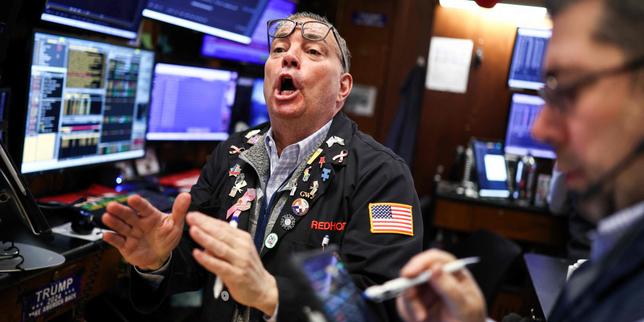
Financial markets operate on the containment of variables; the prospect of direct conflict between Iran and global powers introduces a non-linear risk profile that standard volatility models struggle to price. While surface-level analysis suggests a simple "uncertainty" discount on equities, the actual mechanism of market decay follows a three-tiered structural breakdown: energy supply-chain strangulation, monetary policy divergence, and the "flight to quality" liquidity trap. Understanding the current Wall Street stagnation requires moving beyond the "fog of war" metaphor and examining the specific transmission channels through which Middle Eastern instability devalues Western capital.
The Crude Oil Transmission Mechanism
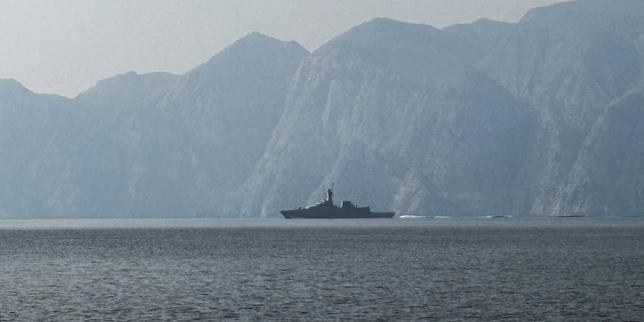
The primary friction point for equity markets during Iranian escalation is the recalibration of the global cost function. Unlike localized conflicts, an Iranian engagement threatens the Strait of Hormuz, a chokepoint responsible for approximately 20% of the world’s liquid petroleum consumption.
The market does not price a "potential" war; it prices the disruption of the marginal barrel of oil. This creates a feedback loop in the S&P 500 through the following vectors:
- Input Cost Compression: For non-energy sectors, particularly transport and manufacturing, rising crude prices act as an immediate tax on margins. If the Brent-WTI spread widens due to regional instability, European and Asian markets often see faster de-leveraging than U.S. domestic indices.
- The Inflationary Floor: A spike in energy costs prevents central banks from executing planned rate cuts. Wall Street’s "brouillard" (fog) is actually a recalibration of the Discounted Cash Flow (DCF) models. If energy-driven inflation remains "sticky," the terminal rate for the Federal Reserve stays higher for longer, lowering the present value of future earnings.
Tactical Asset Allocation and the Liquidity Trap
When geopolitical risk exceeds a specific threshold—historically correlated with direct attacks on sovereign infrastructure—investor behavior shifts from "risk-on" speculation to "capital preservation" mandates. This shift is not a gradual slide but a binary transition.
The Flight to Quality Hierarchy
- US Treasuries: Despite domestic fiscal concerns, the 10-year Treasury remains the primary recipient of panicked capital. This creates a paradoxical environment where yields may drop due to high demand, even as the underlying economic outlook worsens.
- Gold and Hard Assets: Gold serves as a hedge against currency debasement and systemic collapse. During periods of Iranian tension, the correlation between gold and the USD often breaks, with both rising simultaneously—a rare "double-strength" signal of extreme risk aversion.
- The Dollar Smile: The USD strengthens during crises because of its role as the global reserve currency. However, a too-strong dollar hurts the repatriated earnings of U.S. multinationals, leading to a downward revision in quarterly guidance.
Structural Asymmetry in Market Reactions
Financial markets exhibit an asymmetrical reaction to Iranian military developments. A "de-escalation" event typically results in a minor, short-lived relief rally, whereas an "escalation" event triggers a violent, high-volume sell-off. This is due to the Short-Volatility Bias inherent in modern algorithmic trading.
Most institutional funds use Value-at-Risk (VaR) models that assume a normal distribution of returns. Direct conflict in the Persian Gulf is a "fat-tail" event. When these models are breached, automated selling is triggered to protect remaining capital, creating a cascading effect that has little to do with the actual fundamentals of the companies being sold. The "fog" mentioned by observers is the visual representation of these algorithms hitting their stop-loss limits in a low-visibility environment.
The Defense Sector Arbitrage
While the broader market retreats, the defense and aerospace sectors act as a counter-cyclical hedge. This is not merely a reaction to increased procurement orders but a reflection of the Defense Risk Premium.
Investors reallocate capital into "Primes" (Lockheed Martin, Raytheon, Northrop Grumman) because their revenue streams are detached from consumer sentiment and tied instead to national security imperatives. This creates a bifurcation in the market where "Value" and "Defense" outperform "Growth" and "Tech," altering the internal breadth of the major indices.
Geopolitical Stasis and the VIX
The CBOE Volatility Index (VIX) serves as the "fear gauge," but in the context of Iran, it often acts as a lagging indicator. The real metric to watch is the VIX Futures Term Structure.
In a standard market, the structure is in "contango" (future prices are higher than spot prices). When an Iranian conflict becomes the dominant narrative, the curve moves toward "backwardation." This inversion signals that institutional players are paying a massive premium for immediate protection, indicating that they expect the most significant damage to occur in the next 30 days rather than the distant future.
The current Wall Street hesitation is a manifestation of this "waiting for the drop." Traders are not necessarily bearish on the economy; they are unwilling to be long on a market that could be gapped down by a Sunday night headline from Tehran or Tel Aviv.
Strategic Capital Positioning
To navigate this environment, a disciplined analyst moves away from broad-index exposure and toward a "Barbell Strategy." This involves holding high-liquidity cash equivalents on one end to capitalize on the eventual "blood in the streets" entry points, and specific commodity-linked equities or defense contractors on the other.
The volatility is the product, not the obstacle. The objective is to identify the point where the risk of the conflict is fully "priced in"—usually when the VIX crosses the 30-35 threshold and the RSI (Relative Strength Index) on major oil producers hits overbought territory. At that juncture, the narrative usually shifts from "geopolitical fear" to "economic overextension," allowing for a tactical re-entry into depressed high-quality tech stocks.
Monitor the spread between the 2-year and 10-year Treasury notes. If the curve flattens aggressively during an escalation, it suggests the market expects the conflict to trigger a recession. If the curve steepens, it indicates the market believes the inflationary pressure of high oil will force the Fed's hand. Position your portfolio not on the outcome of the war, but on the Fed’s inevitable reaction to the energy price shock.